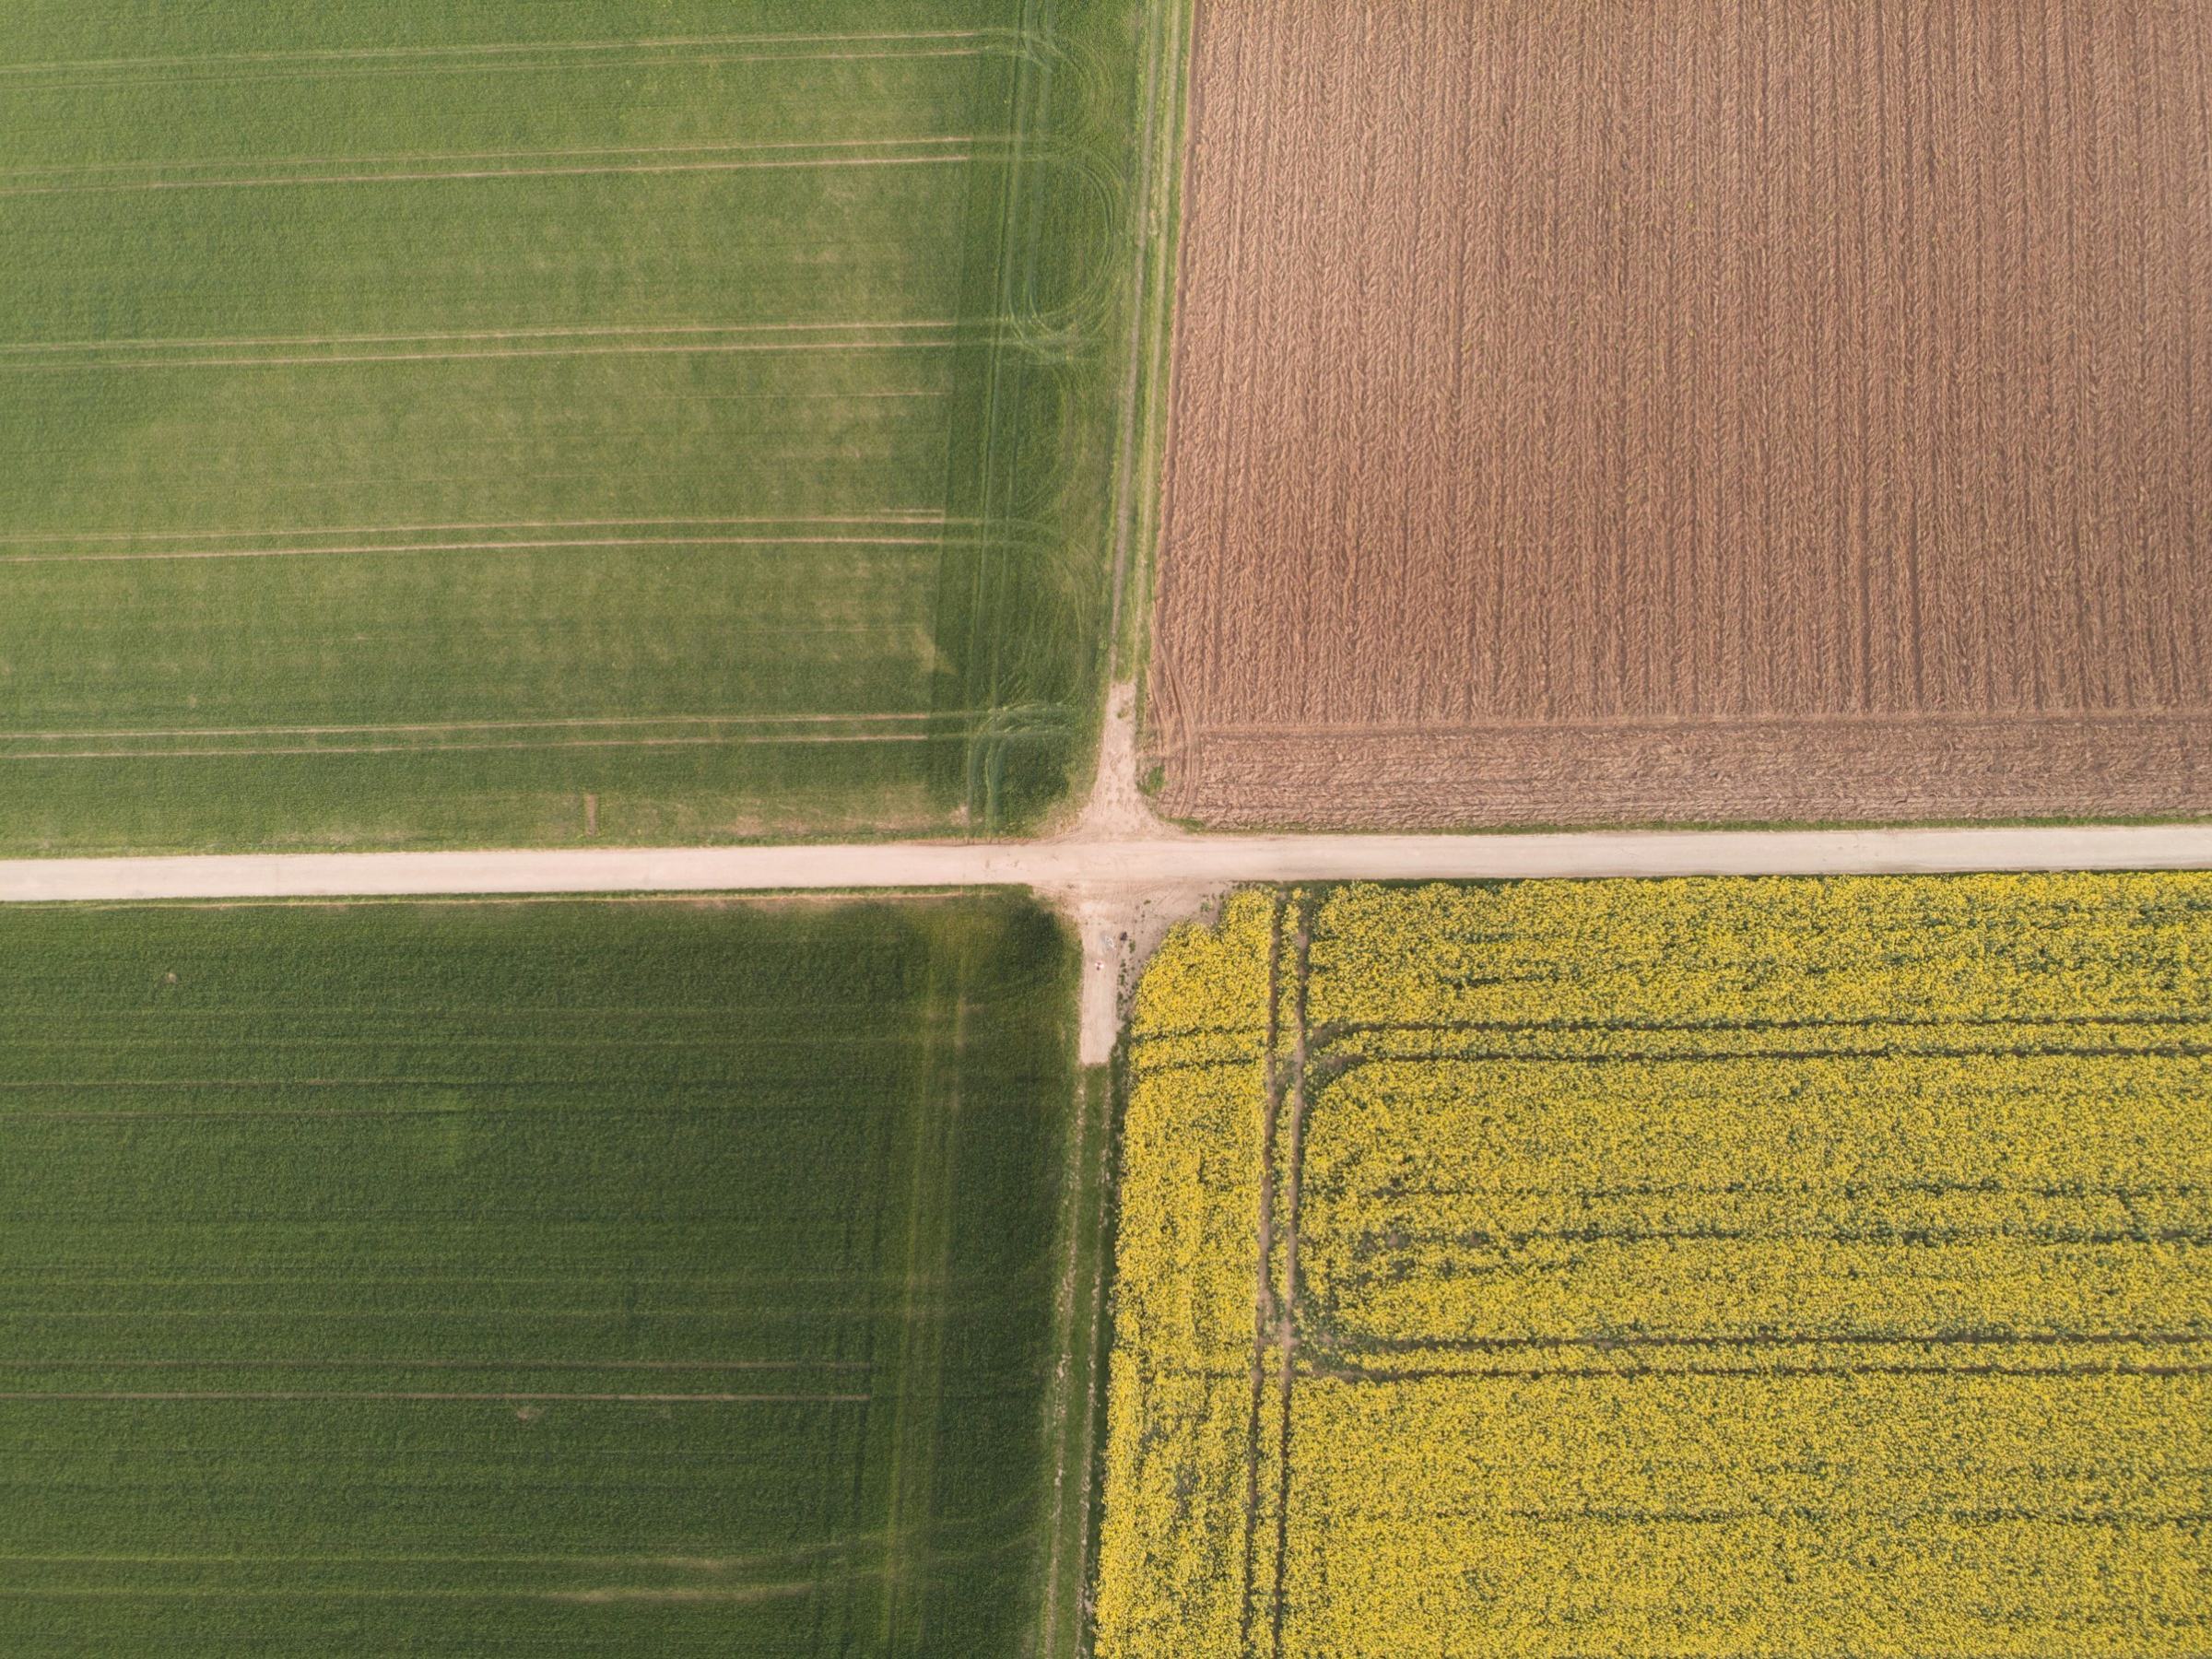
Every field, read every five days.
Swath turns satellite passes into a map of where your crop is thriving, thirsty or falling behind, and a spray file your tractor can use the same afternoon.
Read for 2,400 farms and the co-ops that buy from them.
From 40 hectare family farms to grain co-ops with 900 members. Agronomists use the same map the farmer sees.
Watch a wheat field grow from orbit.
3.2 ha are 0.11 below the field. Likely a nitrogen gap after the March rain.
Still wet two days after 41 mm. Route adjusted to keep the sprayer off it.
Ripening four days ahead of the north. Start the combine here.
Five layers from one pass.
Each pass over your farm is turned into the same stack of maps. Hover a layer to lift it out.
True colour, cloud removed
Cloud and its shadow are masked pixel by pixel, so you only look at the ground.
Crop vigour index
10 m pixels, compared with this field’s own history, so a light soil is not flagged every year.
Soil moisture
Radar sees through cloud, so a grey week is still a week you can read.
Management zones
Three to five zones per field, drawn from six seasons of vigour and your yield maps.
Prescription file
ISOXML or shapefile, ready for most terminals sold in the last ten years.
Fields we read this summer. Hover to see them in 10 m pixels.
Four farms, four crops, the same map. Numbers are from their 2026 season.
read in the 2026 season, up from 0.6M in 2025
less nitrogen on average with the same yield, across 186 farms
from satellite pass to the map on your phone
from the Beauce to Podillia, wheat to sugar beet
From orbit to the tractor cab in one afternoon.
No drone flights, no sensors to install. Draw your field boundaries once and Swath reads them on every clear pass.
The satellite passes
Sentinel-2 images a 290 km strip. Your fields are somewhere in it.
Cloud comes off
We mask cloud and shadow, correct for haze and compute the index for every 10 m pixel.
You get one note
Only when part of a field moves away from its own normal. Most passes, nothing to do.
The file is in the cab
Approve the rate on your phone. The terminal picks up the file over the air or from USB.
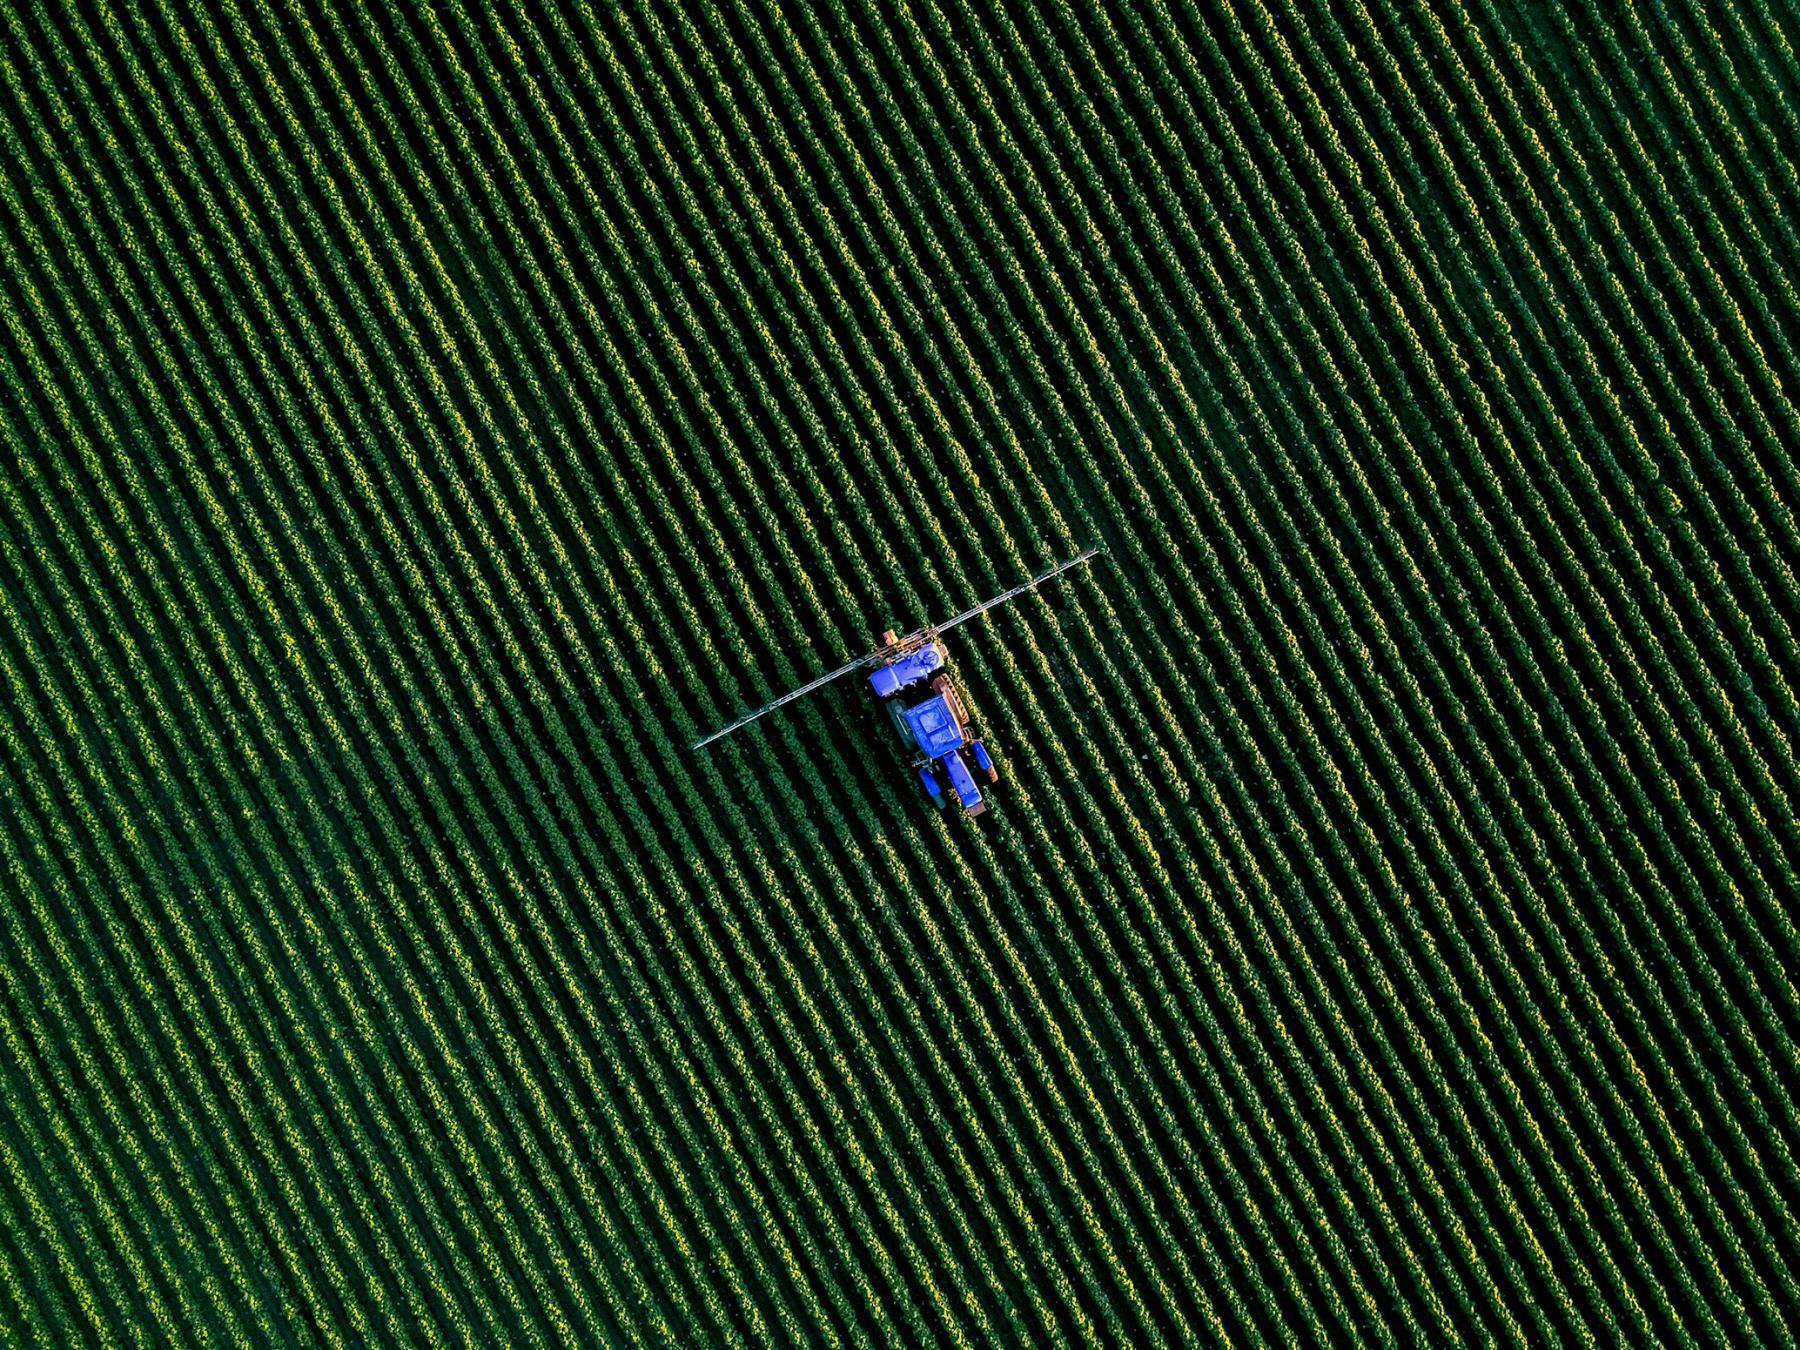
3.2 hectares sprayed instead of 48. The corner had been short of nitrogen for years, and nobody could see it from the road.
Field 12, Lindenau · Winter wheat, 2026Priced per hectare, per season.
€4.20 per hectare up to 500 ha, €3.10 above that. Your first field is free for a whole season, with no card needed.
- Every clear pass, all season
- Six seasons of history per field
- Radar soil moisture
- Unlimited spray files
- Shared map with your agronomist
- App for iOS and Android
Prices without VAT. Co-ops with over 20 member farms get a shared plan.
From the journal
All articlesQuestions farmers ask.
Anything else, write to the agronomy team at hello@swath.farm. A person answers within a working day.
Optical satellites cannot see through cloud, so Swath also reads radar, which can. You still get soil moisture and a coarser growth signal on grey weeks, and the full index the next time the sky clears.
No. Everything comes from satellites that already pass over your farm. You draw your field boundaries once, or import them from your farm software.
We export ISOXML and shapefiles, which most terminals from the last ten years can read. Send us the model before the demo and we will test a file on it.
You do. Field boundaries, yield maps and notes stay yours, are stored in the EU and are never sold. You can export everything or delete it at any time.
Anything above about 2 hectares. Below that a field is only a few hundred pixels and the edges start to blur into the hedge.
Send us one field.
We will read its last six seasons before the call and show you what the satellites already know about it.